Case Analytics
The Analytics page gives you numerical and visual representations of the metadata in your GoldFynch cases.
Accessing the view
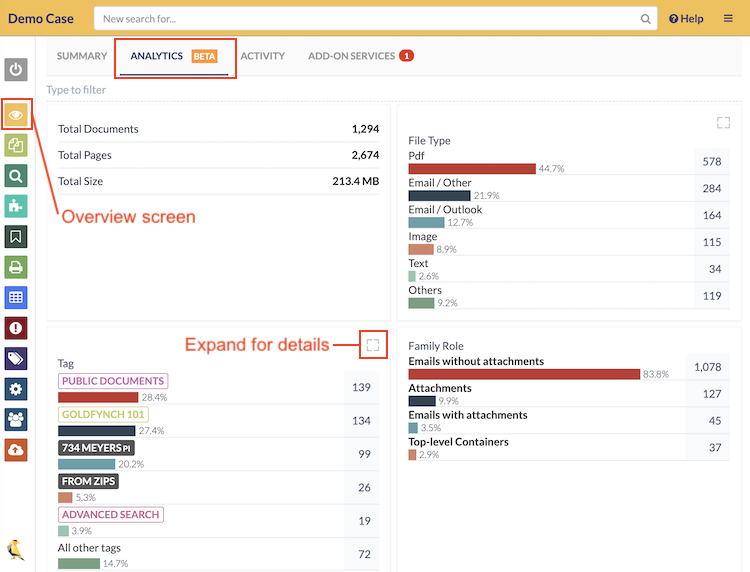
To access the Analytics section click on the "Analytics" tab of the Overview screen - the default screen when you open a case.
Information displayed
The Analytics tool tells you how many of your files are divided according to the following categories:
- The total number of documents, pages, and size of the case
- The types of files present
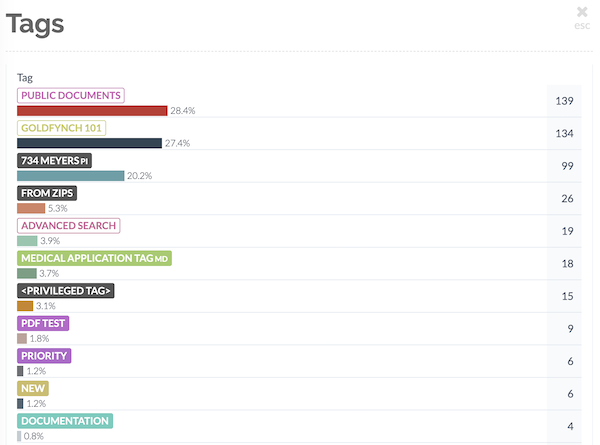
- Tags applied to files
- Files broken down by their role in file families
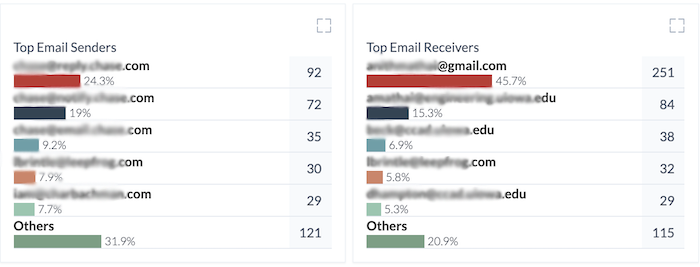
- Sent-by and received-by emails for each individual email address in the case
- How many successfully and unsuccessfully-processed files are present against each cause of failure
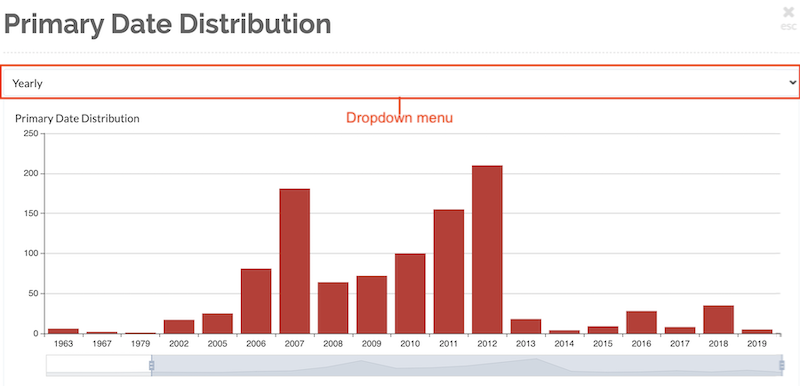
- Primary Dates (along with an interactable timeline that can be used to specify a time range)
- Total email Sent Date and Received Date (with timelines, similar to Primary Dates)
Detailed information
Many of these categories show a subset of values present (the top values) when they are displayed on the main Analytics tab. Click on the expand icon (found in the top-right corner of relevant categories, or the first image of this article) for an exhaustive list of the category's entire distribution.
Filtering information via filter bar
The tool also provides a search bar to find specific information along any of the categories listed above. To filter information start typing text into the "Type to filter" search bar in the top-left corner of the tab. The page will immediately begin filtering relevant information from each category.
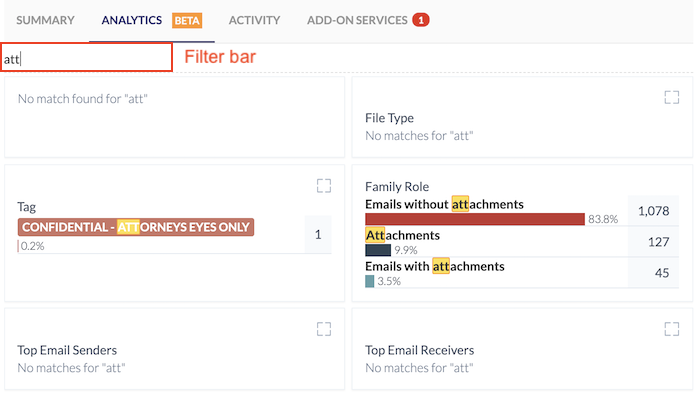
For example, typing “demo@goldfynch.com” in the filter bar would list how many emails were sent and received by that email address, along with the respective percentage from the total emails sent and received.
Similarly, you could use it to quickly find out what proportion of files in your dataset were corrupted on upload, or which tags in your case have been used the most.
Date ranges
The Primary Date, email received-by, and sent-by dates are displayed as graphs on the Analytics page with timelines below each graph that you can interact with. Zoom in and out to focus on a particular time period on a graph by dragging the two markers found on each timeline to the left and right, or by scrolling the mouse wheel while hovering the mouse cursor over a graph.
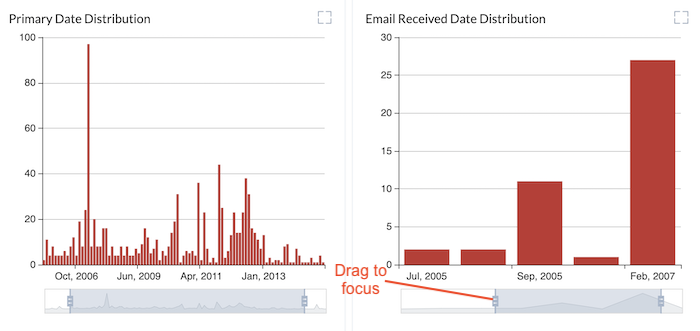
Click on the expand icon on each graph to enlarge it across the screen. In addition to manipulating the date range, you can also to change the distribution to be displayed on a daily, monthly, or yearly basis. To do select the respective option in the drop-down.